An earnings preview is not usually led off with a chart, but in the case of Microsoft (MSFT), I do think it’s warranted.
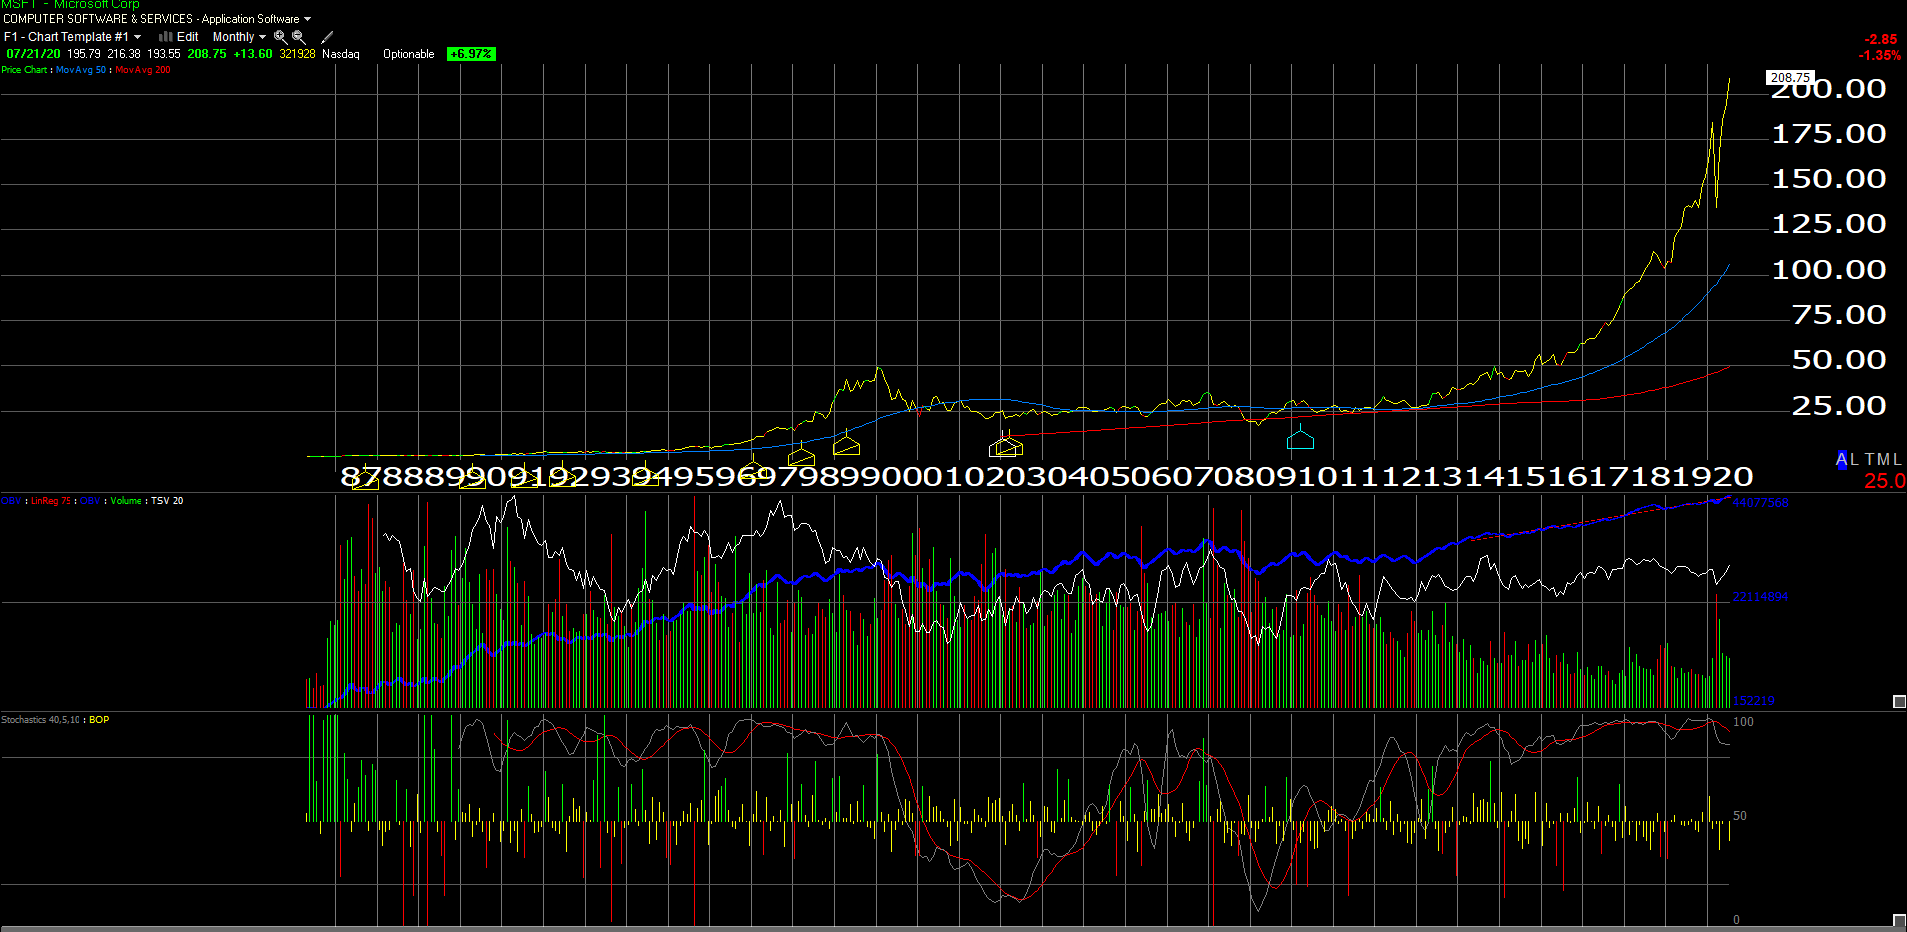
(Source: Worden charts)
In Microsoft’s historic bull market from the mid-1980’s to January 2000, where – according to the above chart – the stock price peaked at $53.81 in January 2000, with the catch being that despite growing revenue and earnings per share every year after that, Microsoft stock price did not permanently exceed the January 2000 high until mid-2016. And as readers can see, the last 4-5 years speak for themselves.
Microsoft is in a second historic bull market run, much of it based on Azure and the pivot towards the cloud that Satya Nadella pulled off after ValueAct took a 1% stake in Microsoft in April 2013 and Satya was named CEO within the next year.
The company has the twin advantage of the installed base from the 1980s and 1990s, which is still 2/3rd of the business and growing nicely, and then adding the ‘Intelligent Cloud”, which is 1/3rd of revenue, but the operating income growth the last 4 years has been stellar:
Table 1
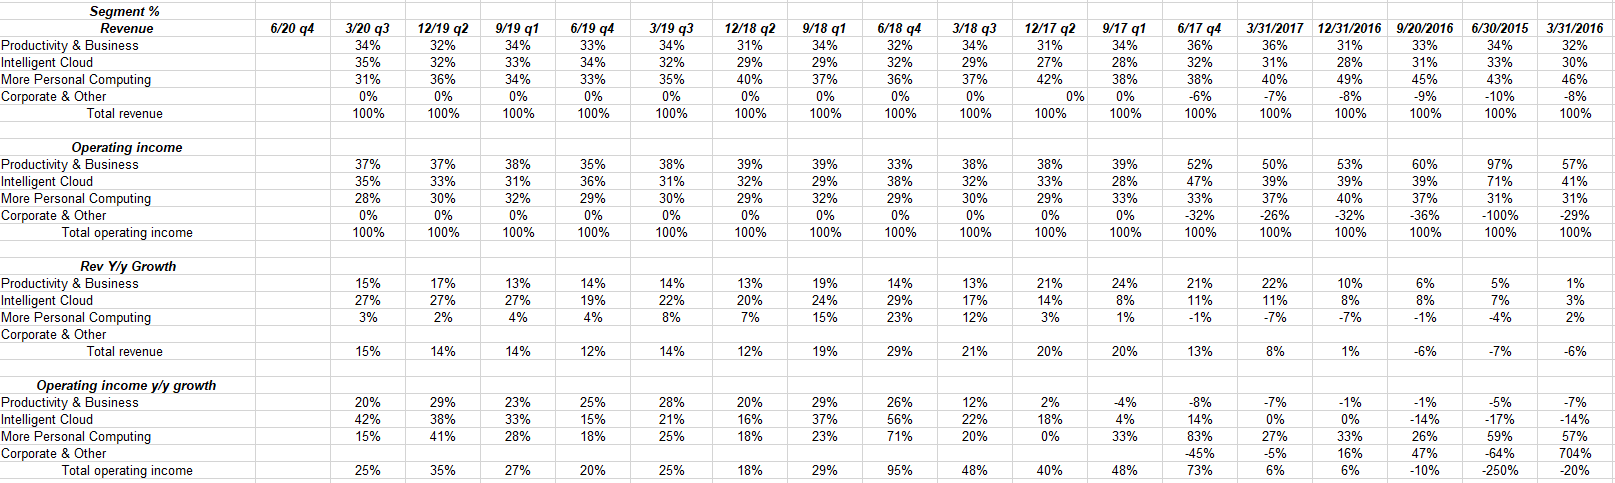
(Source: Internal valuation spreadsheet)
I’d like readers to take note of “operating income y/y growth” section and then find the Intelligent Cloud line. Check that growth rate since March 2016.
Table 2
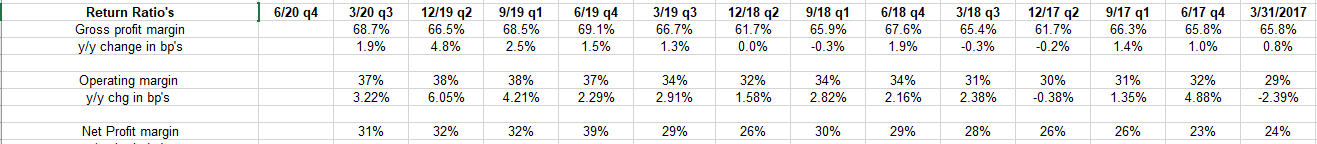
(Source: Internal valuation spreadsheet)
As Intelligent Cloud has taken off, so (not so coincidentally) has the operating margin.
EPS and revenue estimates
| Q4 ’20 Est. | Q3 ’20 | Q2 ’20 | Q1 ’20 | |
| FY ’23 Est. EPS | $7.74 | $7.45 | $7.76 | $7.62 |
| FY ’22 Est. EPS | $7.17 | $7.16 | $7.27 | $6.97 |
| FY ’21 Est. EPS | $6.24 | $6.21 | $6.31 | $5.93 |
| FY ’23 Est. EPS growth rate | 8% | 4% | 7% | 9% |
| FY ’22 Est. EPS growth rate | 15% | 15% | 15% | 15% |
| FY ’21 Est. EPS growth rate | 10% | 9% | 11% | 12% |
| FY ’23 P/E | 27x | 24x | 22x | 18x |
| FY ’22 P/E | 29x | 25x | 24x | 20x |
| FY ’21 P/E | 33x | 29x | 27x | 23x |
| FY ’23 Rev. Est. ($ billion) | $192.4 | $183.2 | $191.6 | 194.7 |
| FY ’22 Rev. Est. | $175.5 | $175.5 | $178.4 | $174.5 |
| FY ’21 Rev. Est. | $156.6 | $156.5 | $159.0 |
$156.2 |
| FY ’23 Est. Rev. growth rate | 10% | 4% | 7% | 12% |
| FY ’22 Est. Rev. growth rate | 12% | 12% | 12% | 12% |
| FY ’21 Est. Rev. growth rate | 11% | 11% | 12% | 11% |
(Estimate Source: IBES data by Refinitiv as of 7/21/20)
Looking at the last 4 quarters of estimate revisions, with the first column being the current estimates just prior to earnings release on Wednesday, July 22, 2020, readers can clearly the see the multiple expansion that has occurred on Microsoft as the P/E on the fiscal 2021 estimate has jumped from 23x 3 quarters ago to 33x just prior to earnings release.
While that’s a mild negative, the positive is that for fiscal ’21 and ’22, the revenue estimates have been fairly stable during the pandemic, which was somewhat surprising to see.
Summary / conclusion
As of last quarter, over 10% of MSFT’s market cap as of 3/31/20 was sitting in cash and equivalents, and unlike the banks, the tech giants have no such restrictions repurchasing stock.
There are many reasons to worry about Microsoft’s position as the 1 or 2 ranked stock by market cap in the S&P 500, as that group has been red-hot all year and has captured much of the mainstream media’s attention. The reversal in the Nasdaq 100 last week on Monday, July 13th, 2020 got a lot of people’s attention, and the Nasdaq’s relative strength has faded since.
Apple (AAPL) is in a 20-year bull market, Facebook (FB) is facing serious brand and other issues, Google (GOOG, GOOGL) is getting attention from the various state attorney’s general, while Microsoft seems to be pulling its weight under the radar and avoiding the bad press.
The Street is expecting $1.34 in earnings per share on $36.5 billion in revenue for MSFT’s fiscal Q4 ended June 30 when the company reports its financial results after the close on Wednesday night, July 22nd, 2020, for expected y/y growth of 11% and 8% respectively. The EPS number has been shaved a few cents since the March quarter, but the consensus revenue estimate of $36.5 billion is actually a little higher than 90 days ago, despite COVID-19.
How many companies do you know that are reporting both EPS and revenue growth still positive at 11% and 8% respectively in a quarter where the S&P 500 EPS is expected to fall 40%?
Fiscal Q4 ’20 and fiscal ’21 (next twelve months) are still all about the Intelligent Cloud and Azure. Microsoft remains in the sweet spot of the cloud market and in the #2 position to Amazon Web Services (AWS).
Cloud adoption is only accelerating, thanks to COVID-19 and the pandemic.
Paying 33x fiscal ’21 earnings for a stock expected to grow 10-15% always seems salty, but the estimate revisions have held up pretty well in the last 90-180 days.
MSFT reports Wednesday, 7/22, after the close.
Disclosure: I am/we are long MSFT. I wrote this article myself, and it expresses my own opinions. I am not receiving compensation for it (other than from Seeking Alpha). I have no business relationship with any company whose stock is mentioned in this article.
source https://jobsearchtips.net/microsoft-earnings-preview-this-second-historic-bull-market-for-the-stock-is-just-4-5-years-old/


No comments:
Post a Comment